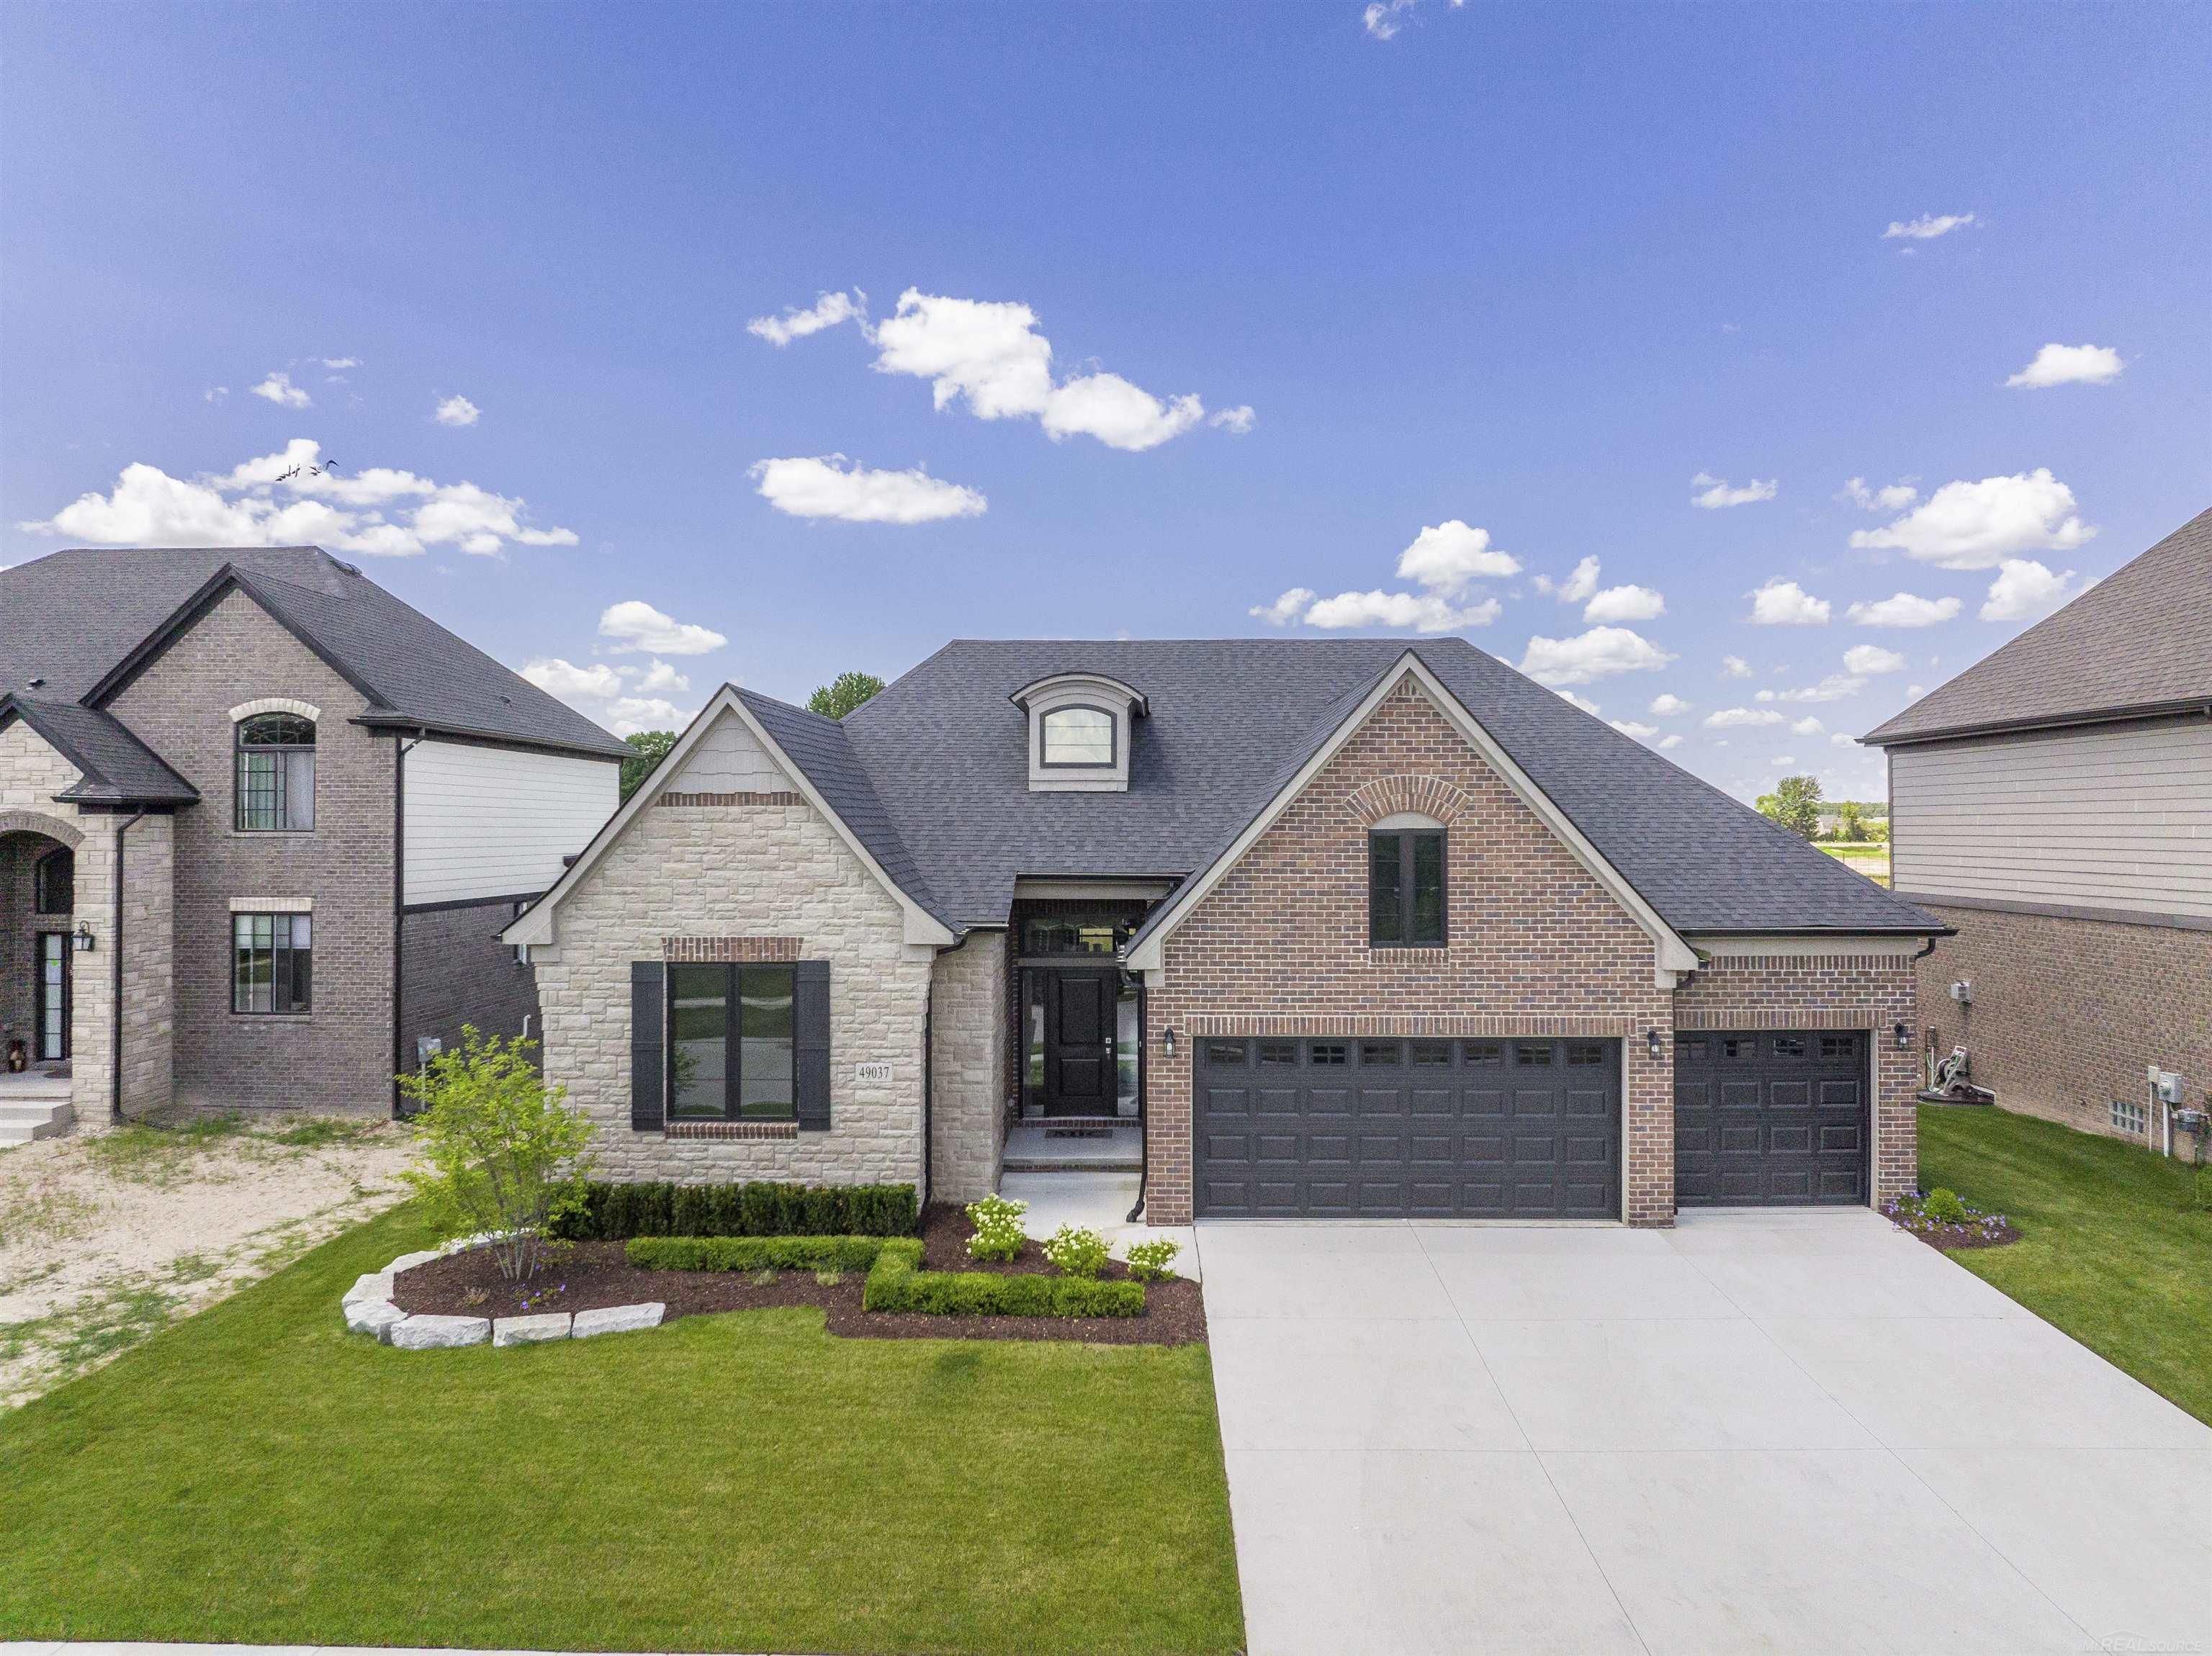
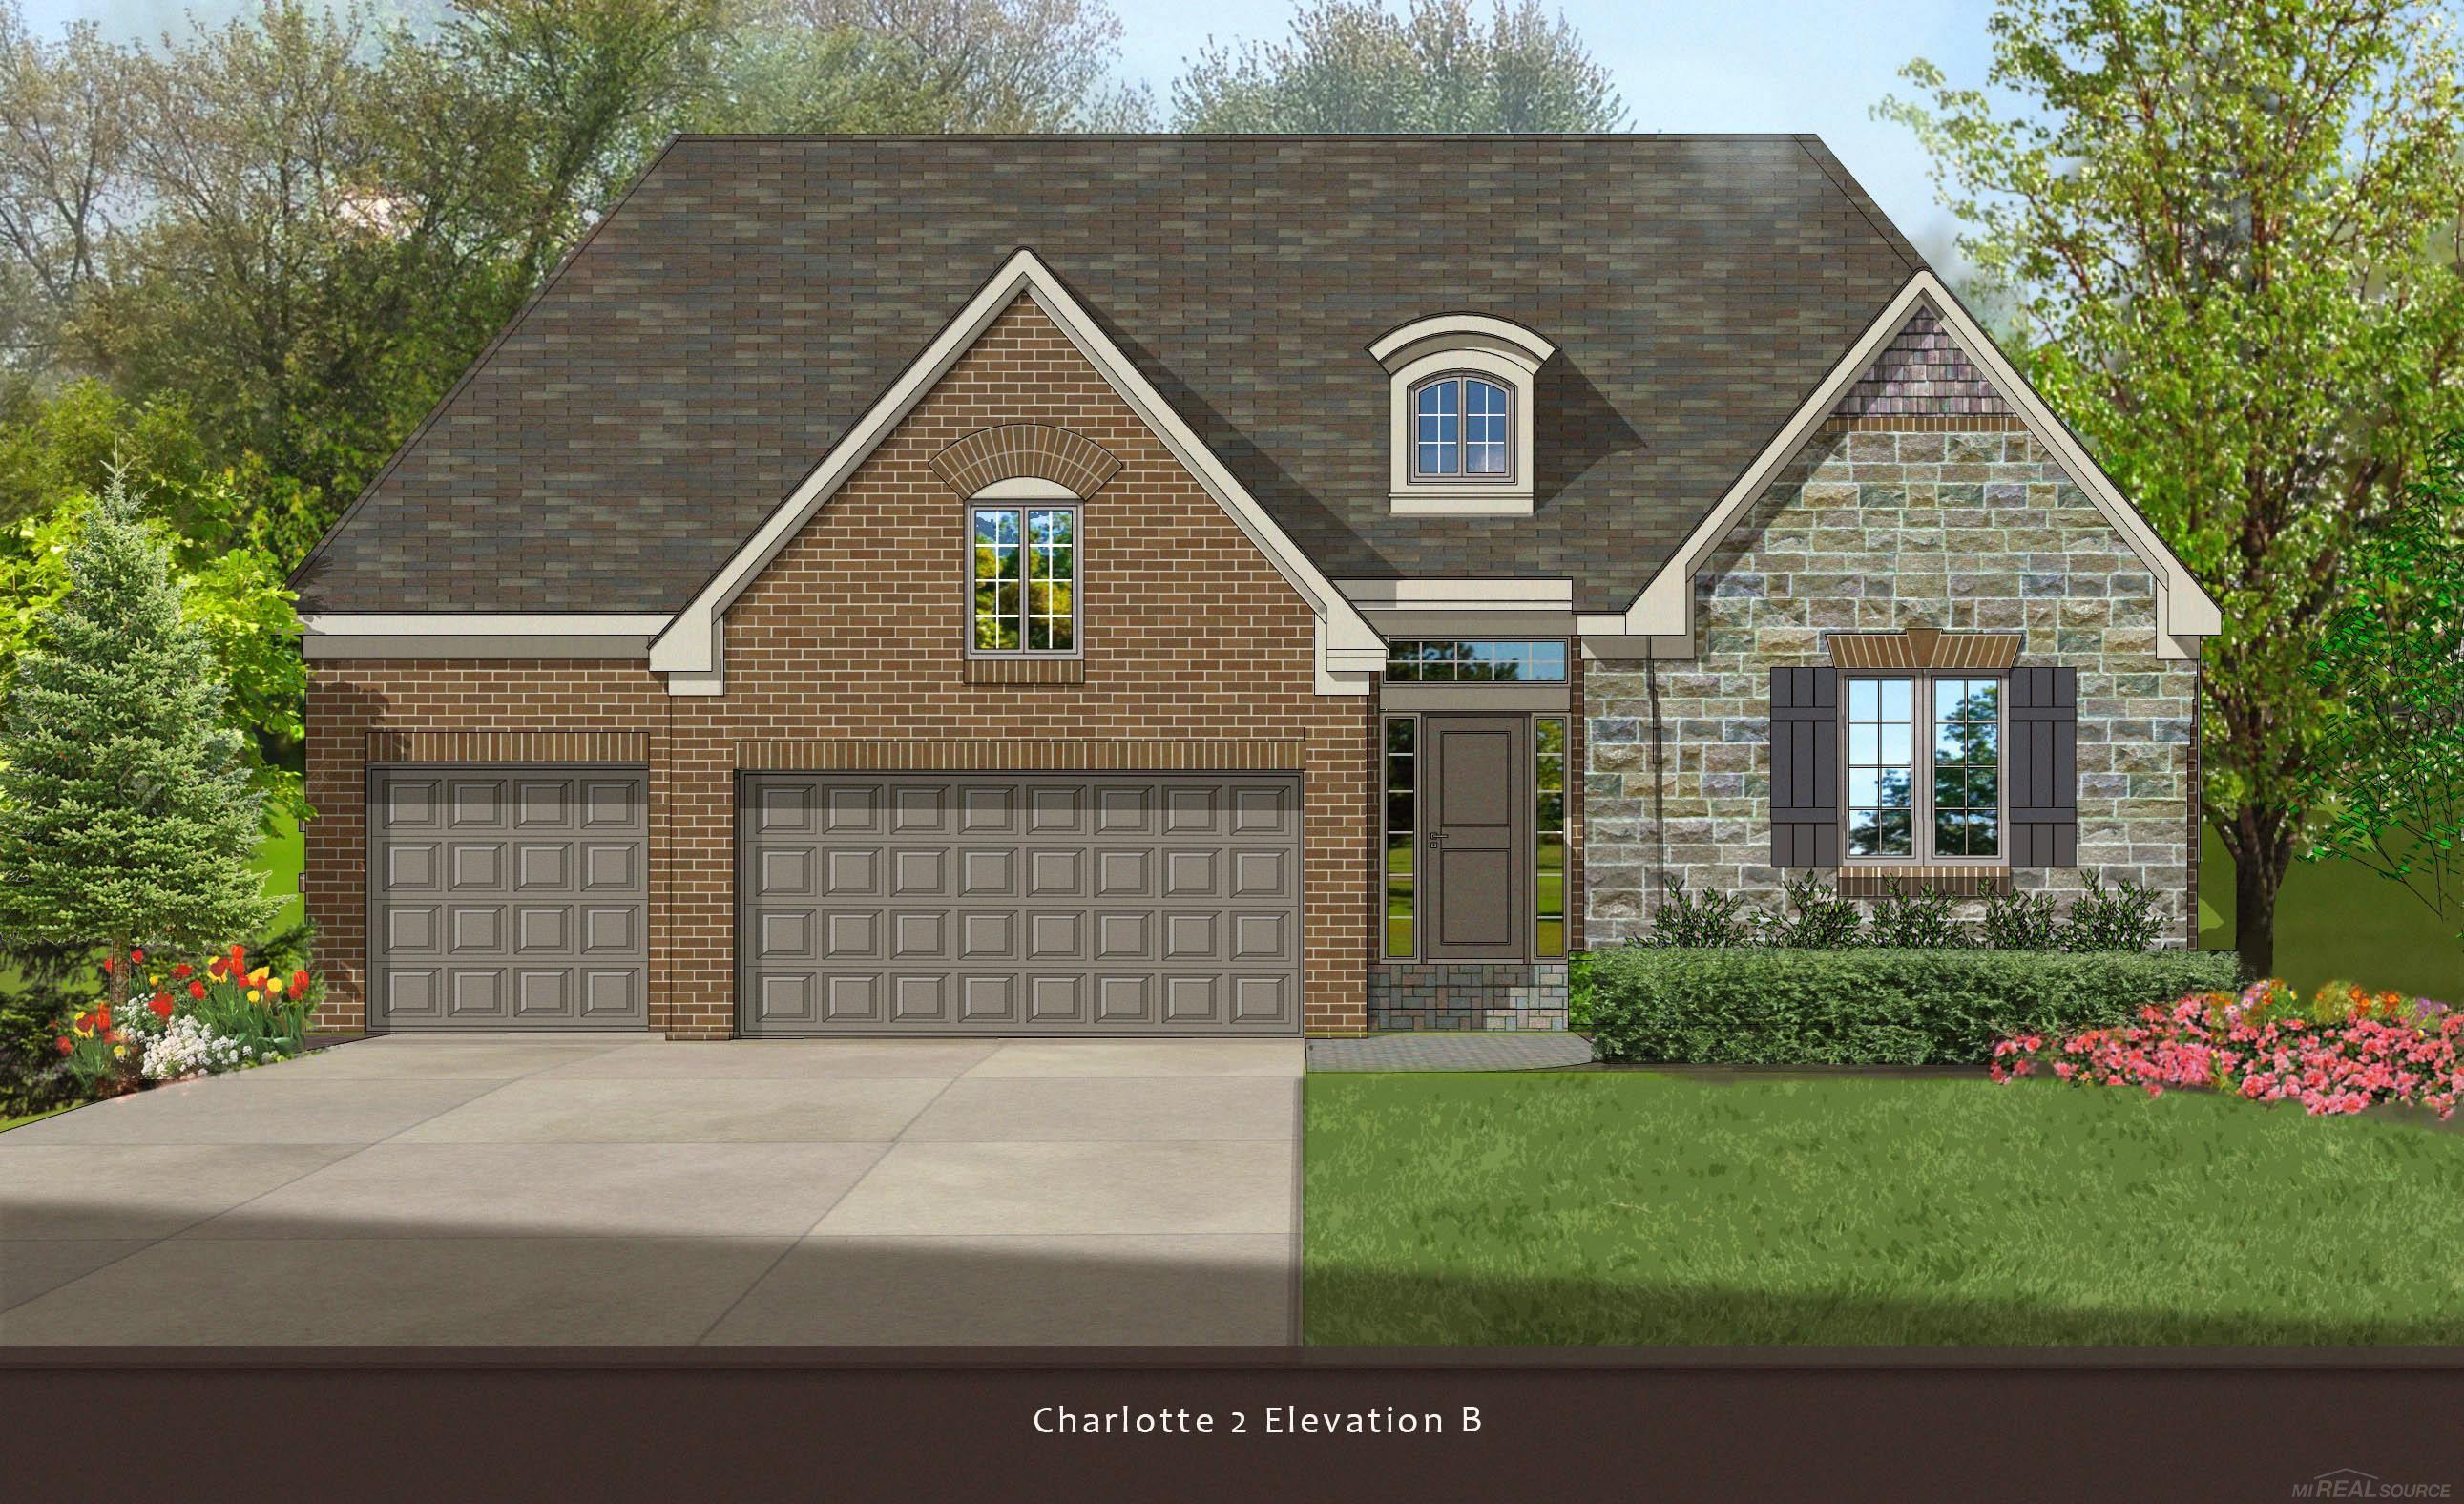
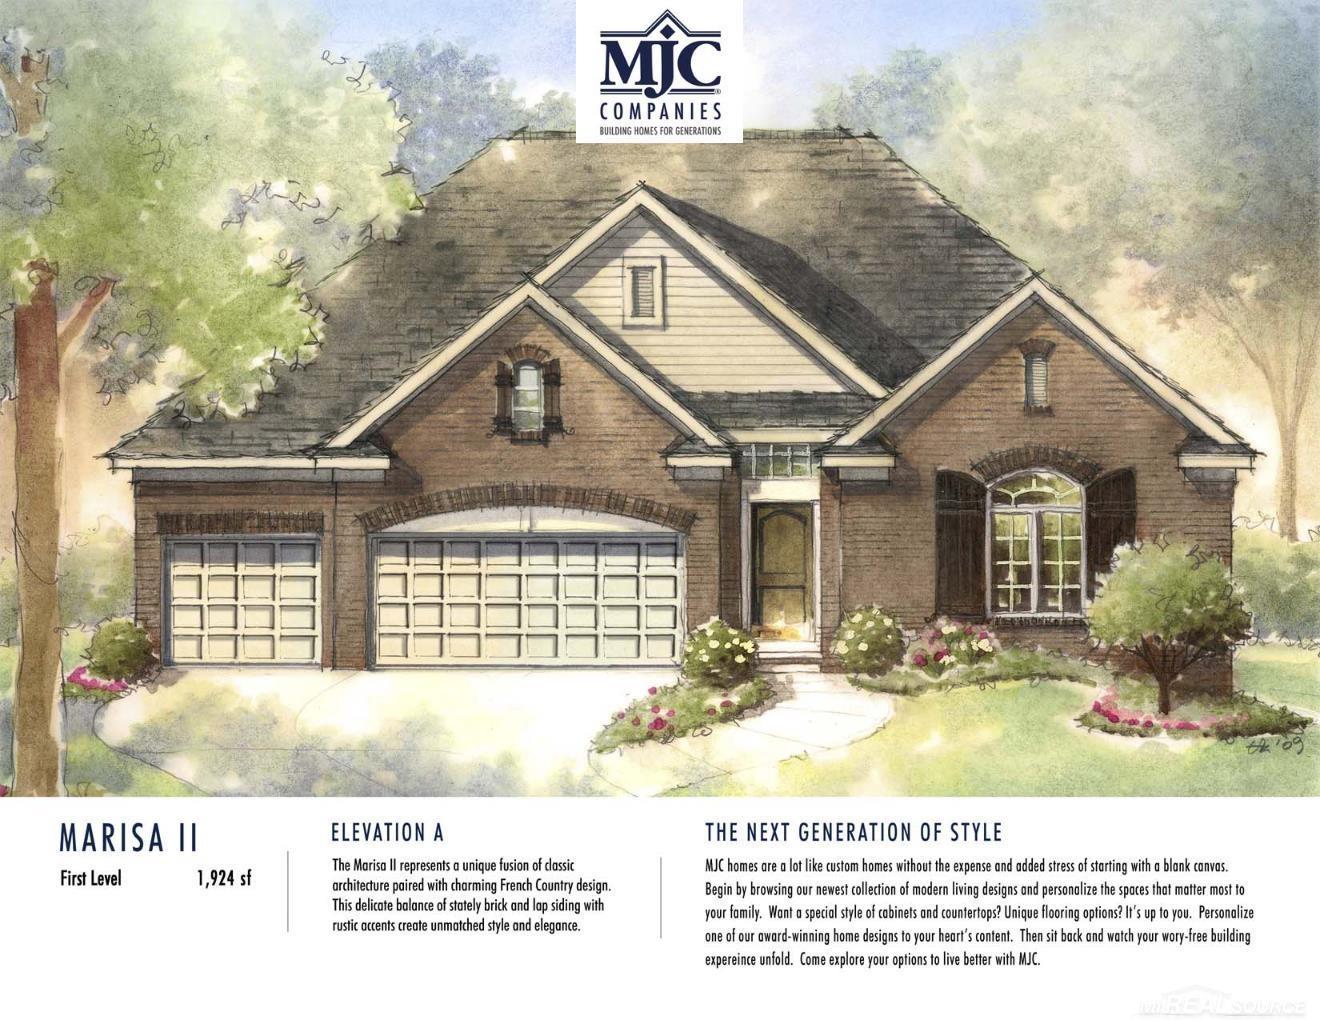
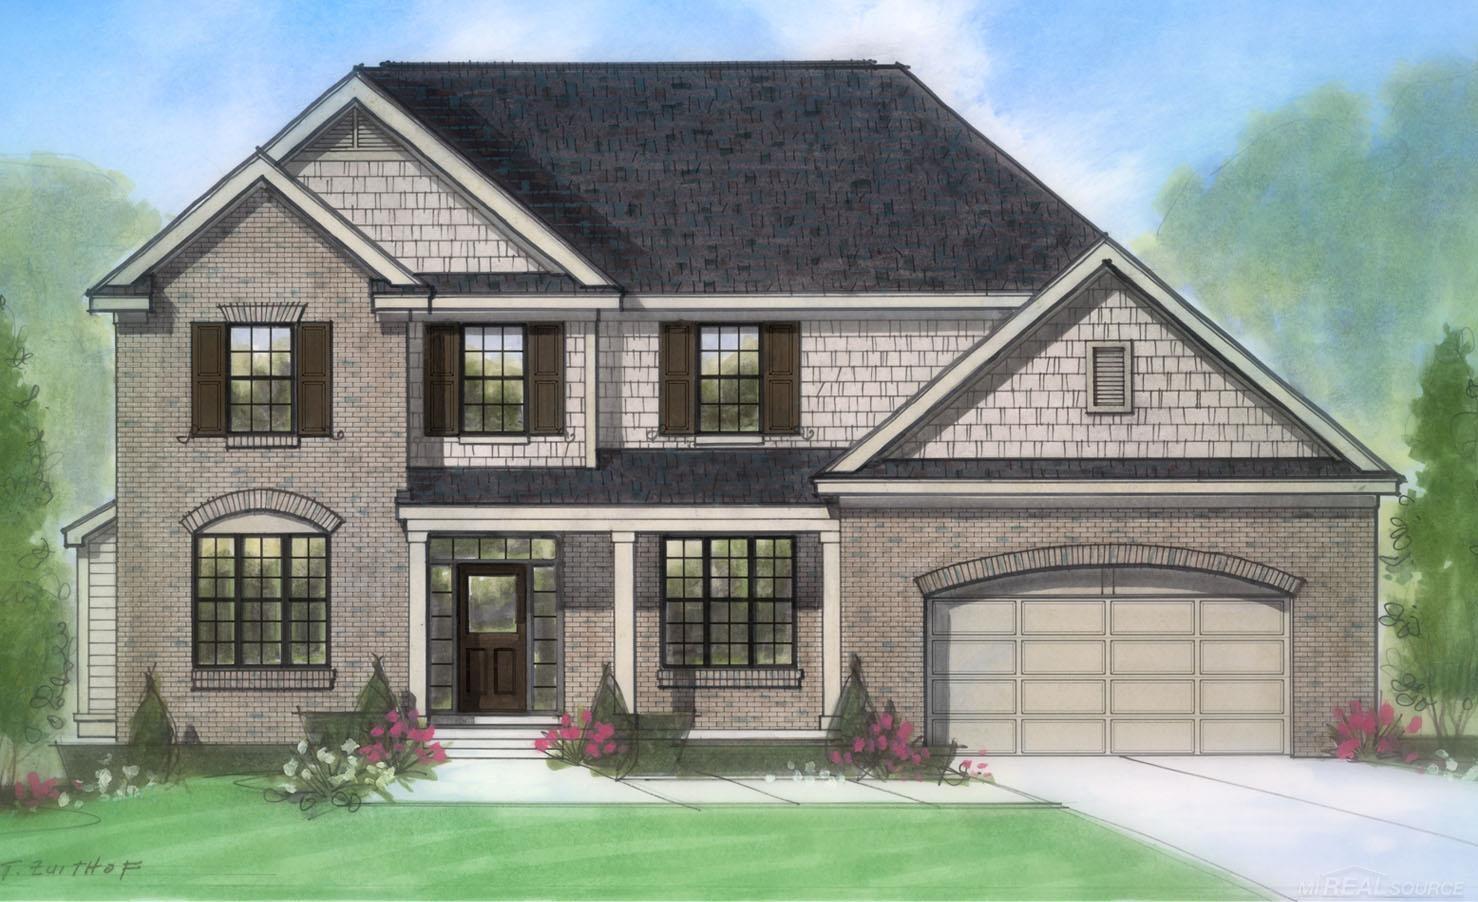
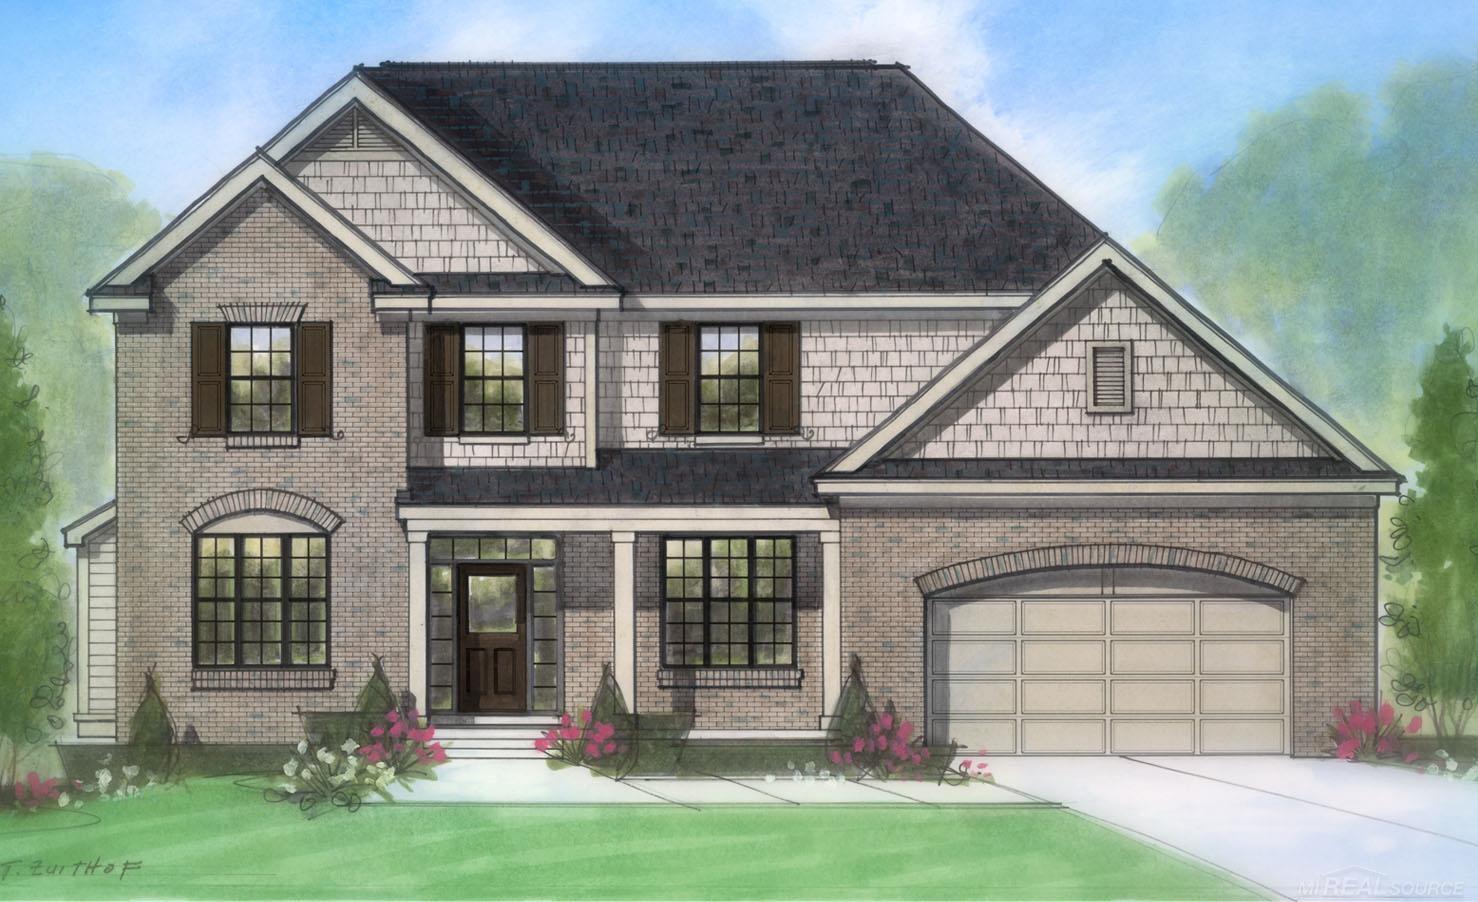
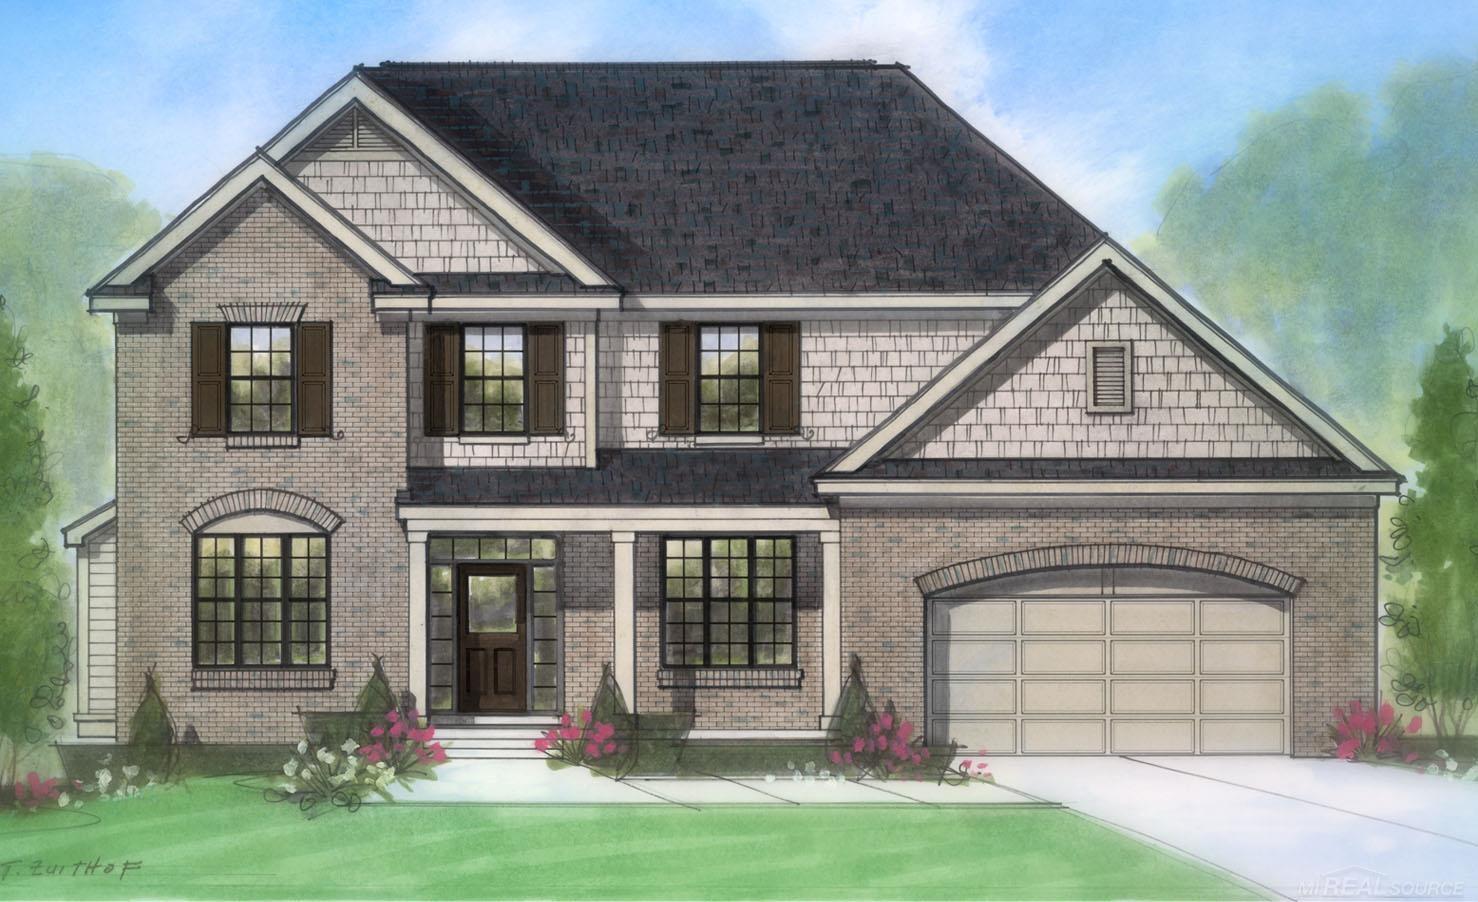
Monarch Estates Real Estate Details

Properties For Sale & Real Estate

Property Search Real Estate Statistics Recently Listed Search by Price Demographics Local Insights

Monarch Estates Real Estate Statistics

Total Properties
10
Avg. Size in Sq. Ft.
2,880
Avg. Age in Years
0.2
Average Days on Site
85
Minimum Price
$580,506
Maximum Price
$649,756
Avg. Price
$619,614
Avg. Price per Sq. Ft.
$233
Recently Listed in Monarch Estates
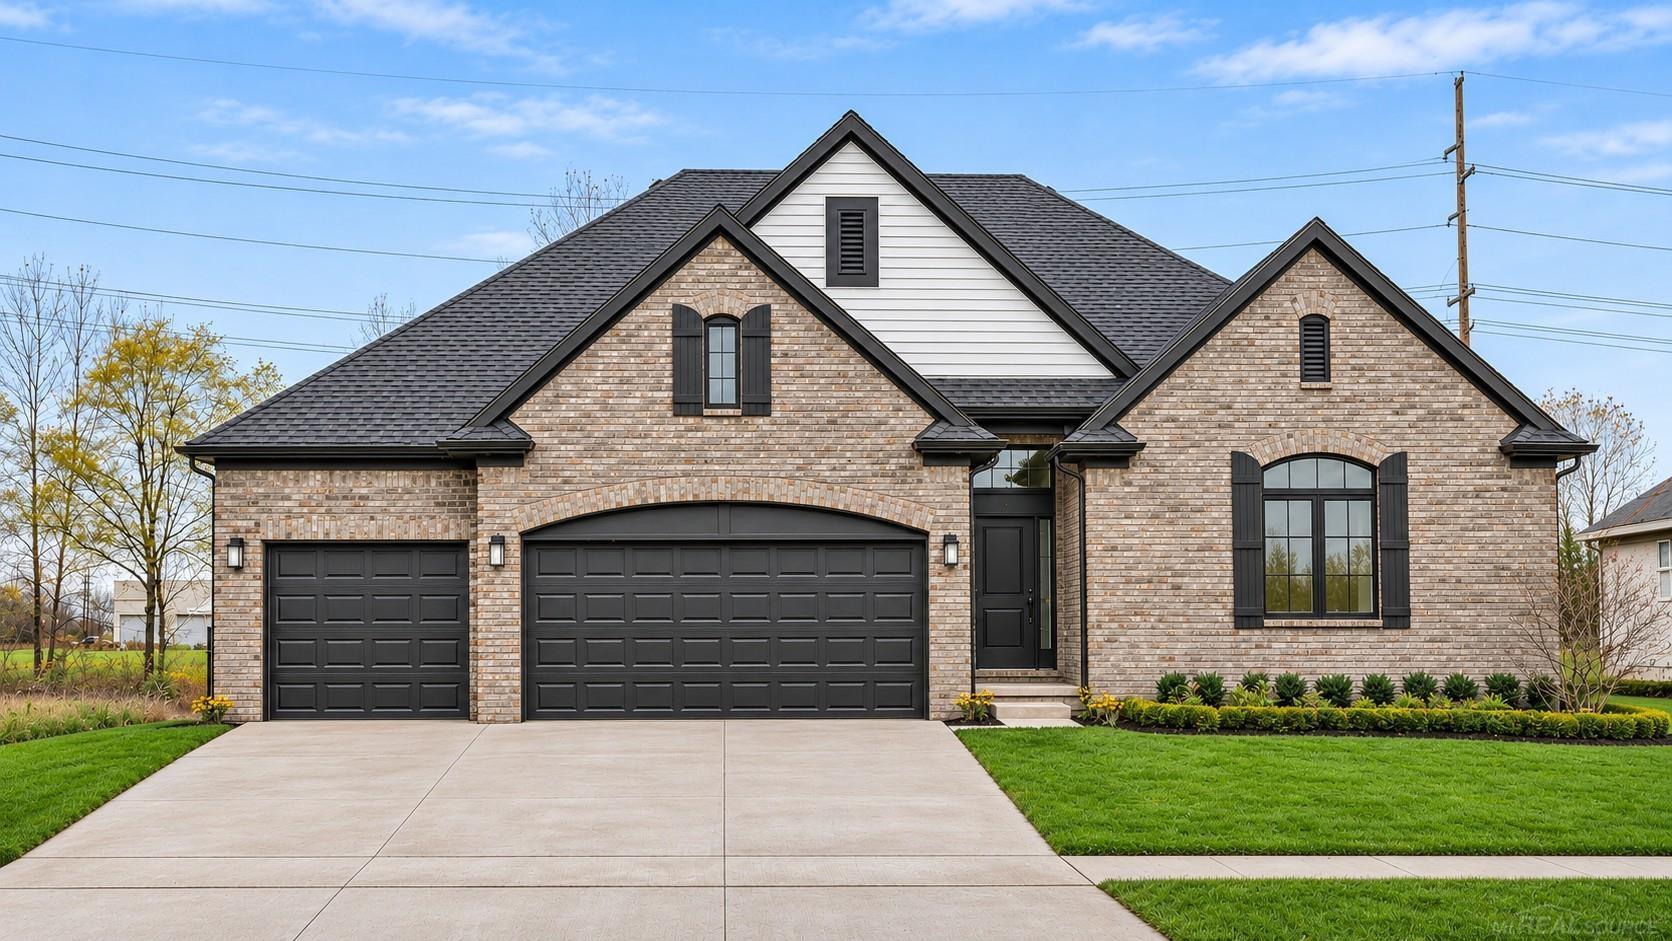
$609,288
MiRealSource IDX Logo
3bds 3ba2,267sqftPending
49675 Langford Drive, Macomb, MI 48044
MLS #: 50208949
MJC Real Estate Co Inc.
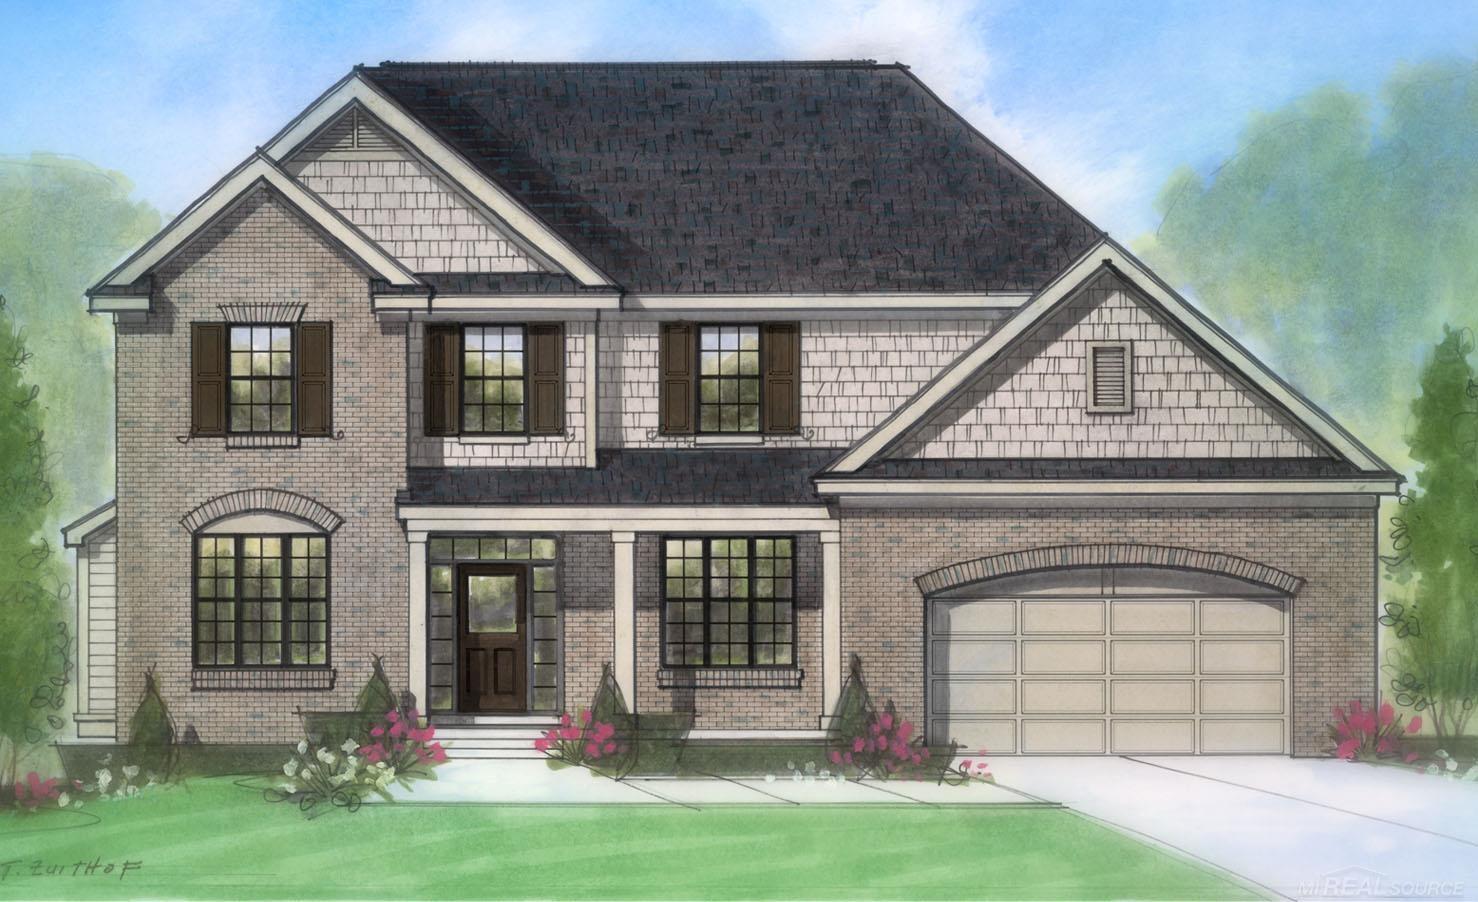
$629,710
MiRealSource IDX Logo
3bds 3ba2,267sqftPending
48937 Bartlet Drive, Macomb, MI 48044
MLS #: 50211605
MJC Real Estate Co Inc.
$580,506
MiRealSource IDX Logo
3bds 3ba1,924sqftPending
16871 Crittenden Drive, Macomb Twp, MI 48044
MLS #: 50214167
MJC Real Estate Co Inc.
$616,832
MiRealSource IDX Logo
4bds 3ba2,841sqftPending
49995 Langford Drive, Macomb, MI 48044
MLS #: 50217116
MJC Real Estate Co Inc.
$649,756
MiRealSource IDX Logo
3bds 3ba1,924sqftActive
16839 Crittenden Drive, Macomb Twp, MI 48044
MLS #: 50219704
MJC Real Estate Co Inc.
$637,500
RealComp IDX Logo
3bds 4ba4,525sqftPending
49389 Monarch Drive, Macomb, MI 48044
MLS #: 20261073584
Sire Realty Frank Tarala
$637,500
MiRealSource IDX Logo
3bds 4ba4,525sqftPending
49389 Monarch Drive, Macomb, MI 48044
MLS #: 61029593
Sire Realty Frank Tarala
$601,892
MiRealSource IDX Logo
4bds 3ba2,841sqftPending
49745 Barlet Drive, Macomb, MI 48044
MLS #: 50222450
MJC Real Estate Co Inc.
$601,861
MiRealSource IDX Logo
4bds 3ba2,841sqftPending
49963 Langford Drive, Macomb, MI 48044
MLS #: 50221352
MJC Real Estate Co Inc.
$631,295
MiRealSource IDX Logo
4bds 3ba2,841sqftPending
49812 Langford Drive, Macomb, MI 48044
MLS #: 50219706
MJC Real Estate Co Inc.

Demographic Information

Macomb County

877,624

Populations as of 2026

459,383

Total Labor Force

$76,399

Median Household Income

$39,467

Per Capita Income

41

Median Age

2

Average Household Size

18.3%

High School Graduate

12.5%

Bachelor Degree Or Higher

Population

2026 Estimate (V2026) 877,624

Age Distribution (Years Old)

0 to 4 5.3%
5 to 17 15.5%
18 to 64 61.3%
65 and Older 17.8%

Gender

Male 49%
Female 51%

Computer and Internet Use

Households with a computer 40.6%
Households with a broadband Internet subscription 40.6%

Language

English or Second Language, Age 5+ 14.4%
English is First Language, Age 5+ 80.3%

Veterans

Veterans 37,389

Housing

Total Housing Units 371,723
Households 356,426
Average Household Size 2 people
Owner-Occupied 30.4%
Multi-Family 0.6%
Owner-Occupied Median Value $231,400
Median selected monthly owner costs - with a mortgage $1,587
Median selected monthly owner costs - without a mortgage $630
Median Gross Rent $1,175

Year at Residence

1 Year or More 9.5%
Less Than 1 Year 90.5%

Business and Employment

Private non-farm Establishments -
Private non-farm Employment -
Nonemployer Establishments 80,799
Number of Firms -

Business Production

Value of Shipments -
Wholesale Trade -
Retail Trade -
Retail Sales Per Capita -
Accommodation and Food Services -
The American Community Survey (ACS) is an ongoing survey that provides data every year - giving communities the current information they need to plan investments and services. The ACS covers a broad range of topics about social, economic, demographic, and housing characteristics of the U.S. population. Much of the ACS data provided on the Census Bureau's Web site are available separately by age group, race, Hispanic origin, and sex. Summary files, Subject tables, Data profiles, and Comparison Summary read more