49064 Real Estate Details

Properties For Sale & Real Estate

Property Search Real Estate Statistics Recently Listed Search by Price Demographics Local Insights

49064 Zip Code Real Estate Statistics

Total Properties
115
Avg. Size in Sq. Ft.
2,280
Avg. Age in Years
1.1
Average Days on Site
388
Minimum Price
$24,900
Maximum Price
$1,655,213
Avg. Price
$270,932
Avg. Price per Sq. Ft.
$213
Recently Listed in 49064 Zip Code
$60,300
MichRIC®, LLC IDX Logo
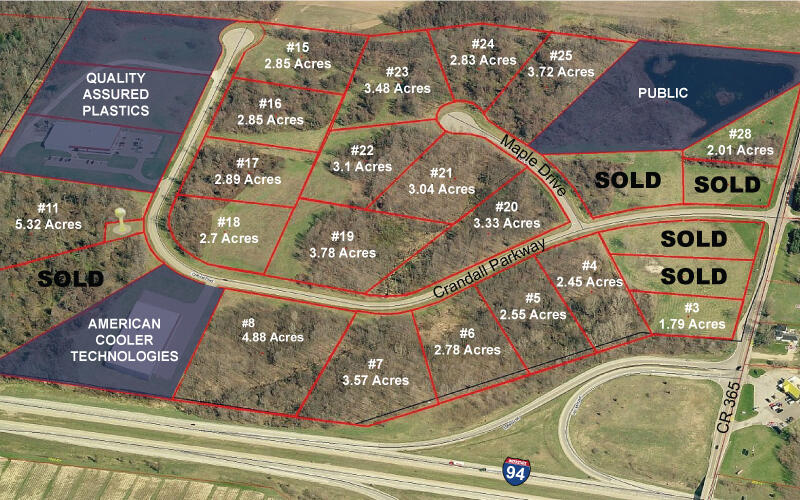
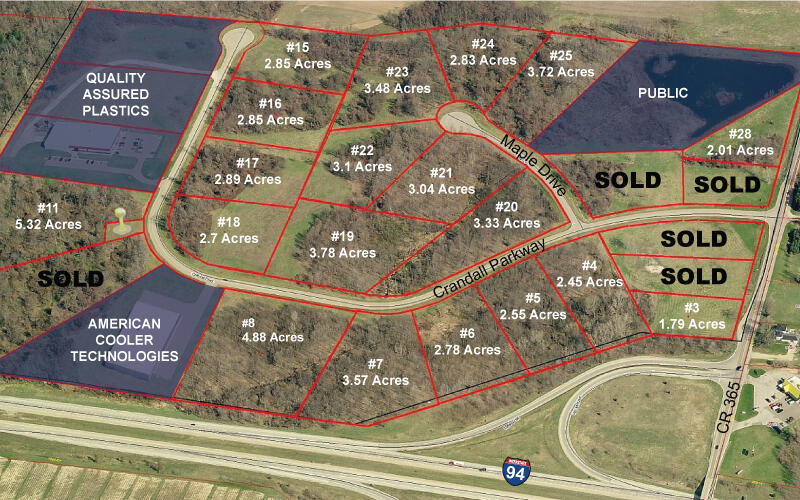
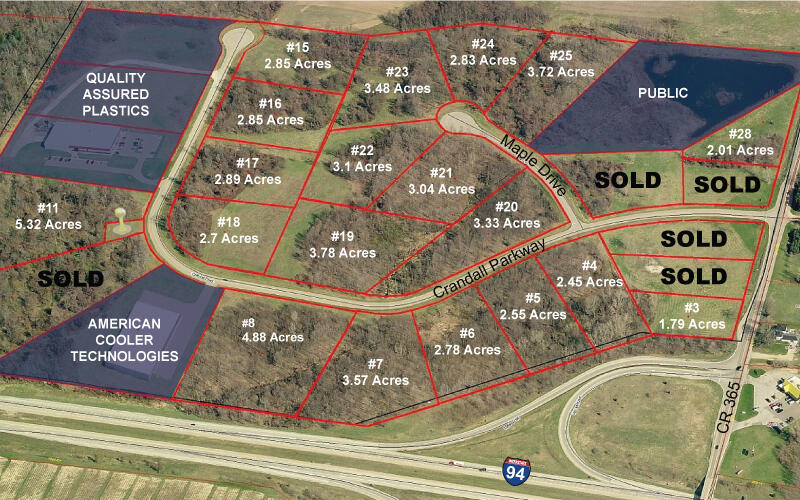
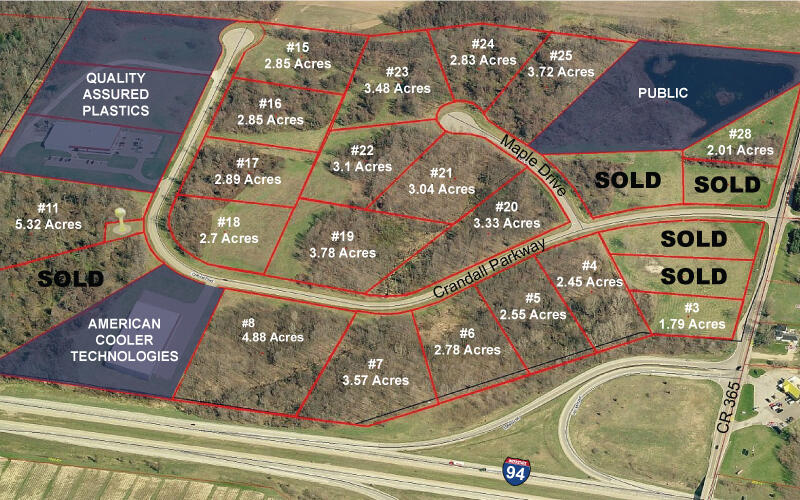
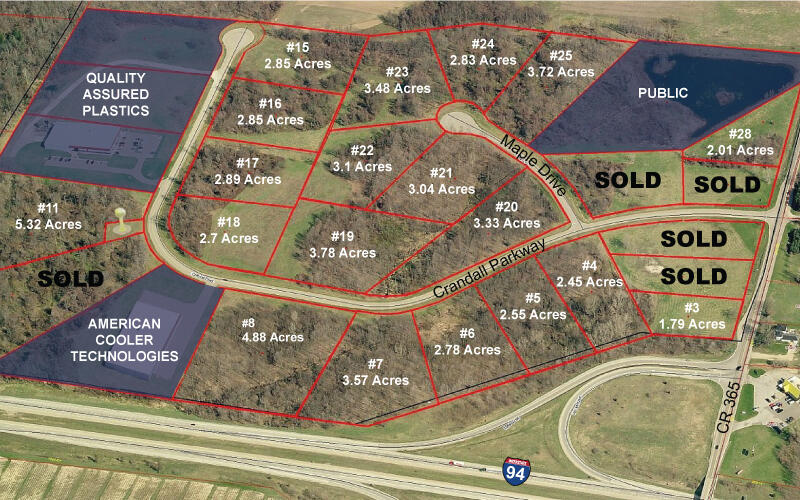
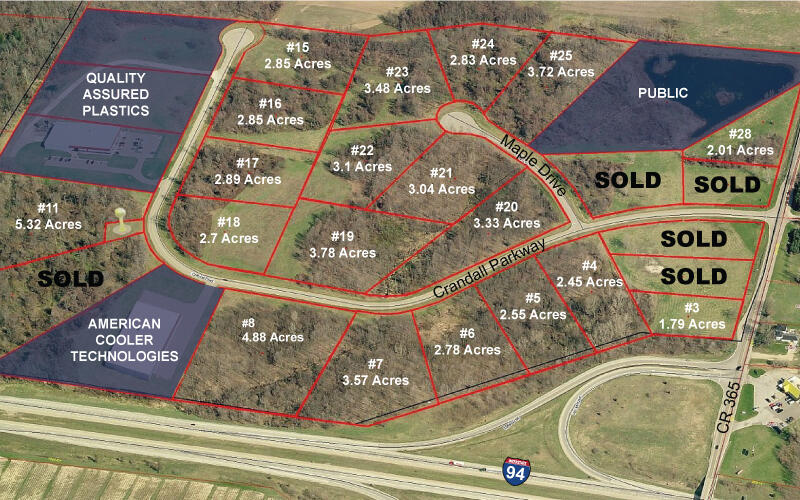
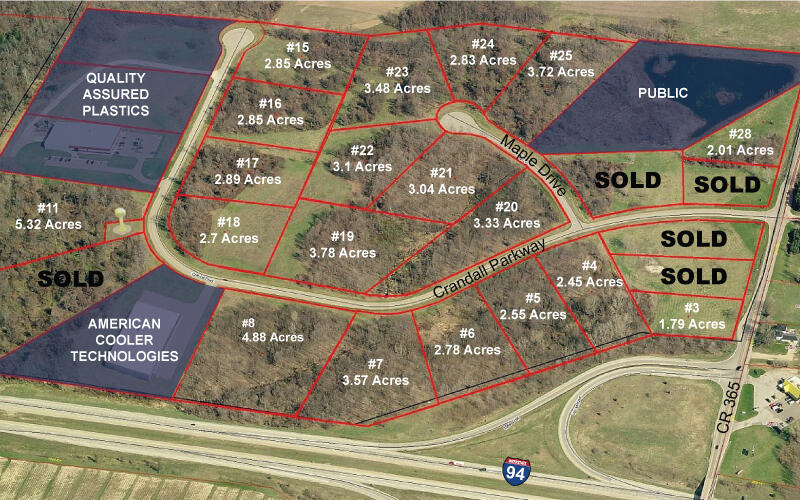
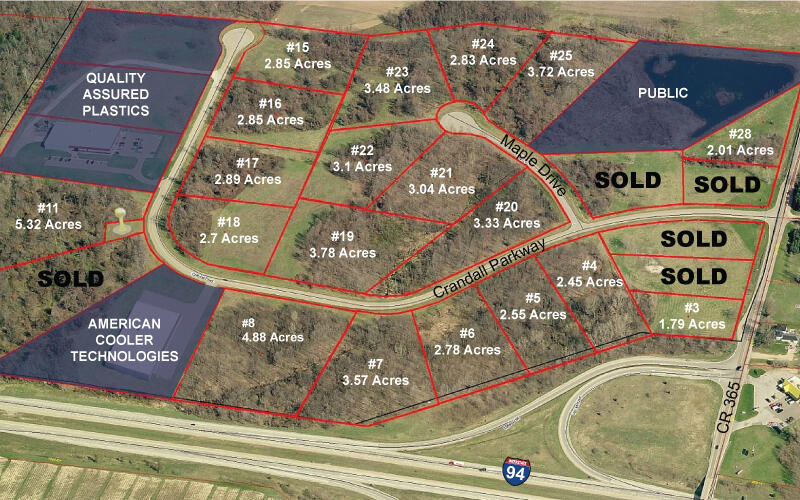
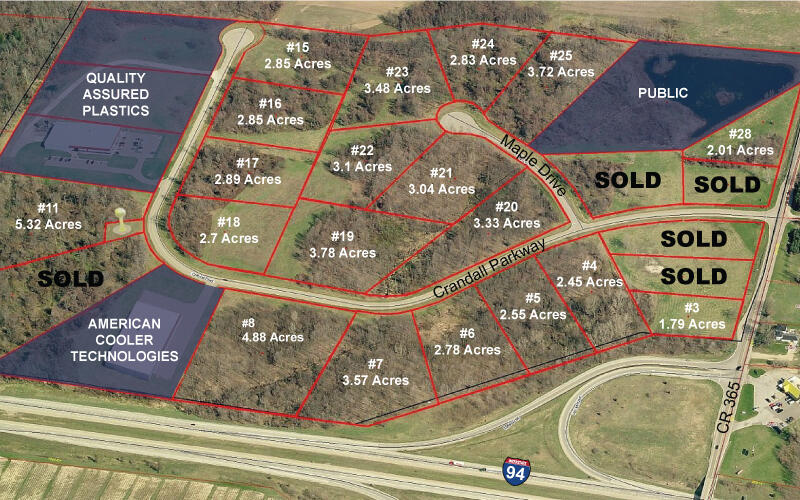
2.01 acre lot$30,000/AcreActive
Crandall Parkway 28, Lawrence, MI 49064
MLS #: 24019295
The Barton Group
$61,250
MichRIC®, LLC IDX Logo
2.45 acre lot$25,000/AcreActive
Crandall Parkway 4, Lawrence, MI 49064
MLS #: 24019275
The Barton Group
$63,750
MichRIC®, LLC IDX Logo
2.55 acre lot$25,000/AcreActive
Crandall Parkway 5, Lawrence, MI 49064
MLS #: 24019277
The Barton Group
$69,500
MichRIC®, LLC IDX Logo
2.78 acre lot$25,000/AcreActive
Crandall Parkway 6, Lawrence, MI 49064
MLS #: 24019278
The Barton Group
$57,000
MichRIC®, LLC IDX Logo
2.85 acre lot$20,000/AcreActive
Crandall Parkway 15, Lawrence, MI 49064
MLS #: 24019284
The Barton Group
$57,000
MichRIC®, LLC IDX Logo
2.85 acre lot$20,000/AcreActive
Crandall Parkway 16, Lawrence, MI 49064
MLS #: 24019285
The Barton Group
$57,800
MichRIC®, LLC IDX Logo
2.89 acre lot$20,000/AcreActive
Crandall Parkway 17, Lawrence, MI 49064
MLS #: 24019287
The Barton Group
$41,625
MichRIC®, LLC IDX Logo
3.33 acre lot$12,500/AcreActive
Crandall Parkway 20, Lawrence, MI 49064
MLS #: 24019293
The Barton Group
$53,200
MichRIC®, LLC IDX Logo
3.04 acre lot$17,500/AcreActive
515 Maple Drive 21, Lawrence, MI 49064
MLS #: 24019308
The Barton Group
$62,000
MichRIC®, LLC IDX Logo
3.10 acre lot$20,000/AcreActive
Crandall Parkway 22, Lawrence, MI 49064
MLS #: 24019310
The Barton Group
$69,600
MichRIC®, LLC IDX Logo
3.48 acre lot$20,000/AcreActive
Crandall Parkway 23, Lawrence, MI 49064
MLS #: 24019313
The Barton Group
$83,342
MichRIC®, LLC IDX Logo
3.57 acre lot$23,345/AcreActive
Crandall Parkway 7, Lawrence, MI 49064
MLS #: 24019281
The Barton Group

Demographic Information

Van Buren County

75,681

Populations as of 2026

35,152

Total Labor Force

$66,902

Median Household Income

$33,243

Per Capita Income

41

Median Age

2

Average Household Size

19.5%

High School Graduate

10%

Bachelor Degree Or Higher

Population

2026 Estimate (V2026) 75,681

Age Distribution (Years Old)

0 to 4 5.7%
5 to 17 17.4%
18 to 64 57.5%
65 and Older 19.4%

Gender

Male 49.8%
Female 50.2%

Computer and Internet Use

Households with a computer 39.8%
Households with a broadband Internet subscription 39.8%

Language

English or Second Language, Age 5+ 9.6%
English is First Language, Age 5+ 84.6%

Veterans

Veterans 3,799

Housing

Total Housing Units 37,243
Households 30,101
Average Household Size 2 people
Owner-Occupied 32%
Multi-Family 1%
Owner-Occupied Median Value $189,900
Median selected monthly owner costs - with a mortgage $1,384
Median selected monthly owner costs - without a mortgage $559
Median Gross Rent $845

Year at Residence

1 Year or More 9.4%
Less Than 1 Year 90.6%

Business and Employment

Private non-farm Establishments -
Private non-farm Employment -
Nonemployer Establishments 5,226
Number of Firms -

Business Production

Value of Shipments -
Wholesale Trade -
Retail Trade -
Retail Sales Per Capita -
Accommodation and Food Services -
The American Community Survey (ACS) is an ongoing survey that provides data every year - giving communities the current information they need to plan investments and services. The ACS covers a broad range of topics about social, economic, demographic, and housing characteristics of the U.S. population. Much of the ACS data provided on the Census Bureau's Web site are available separately by age group, race, Hispanic origin, and sex. Summary files, Subject tables, Data profiles, and Comparison Summary read more